
Tour of the dashboard
The dashboard answers four questions, top to bottom.
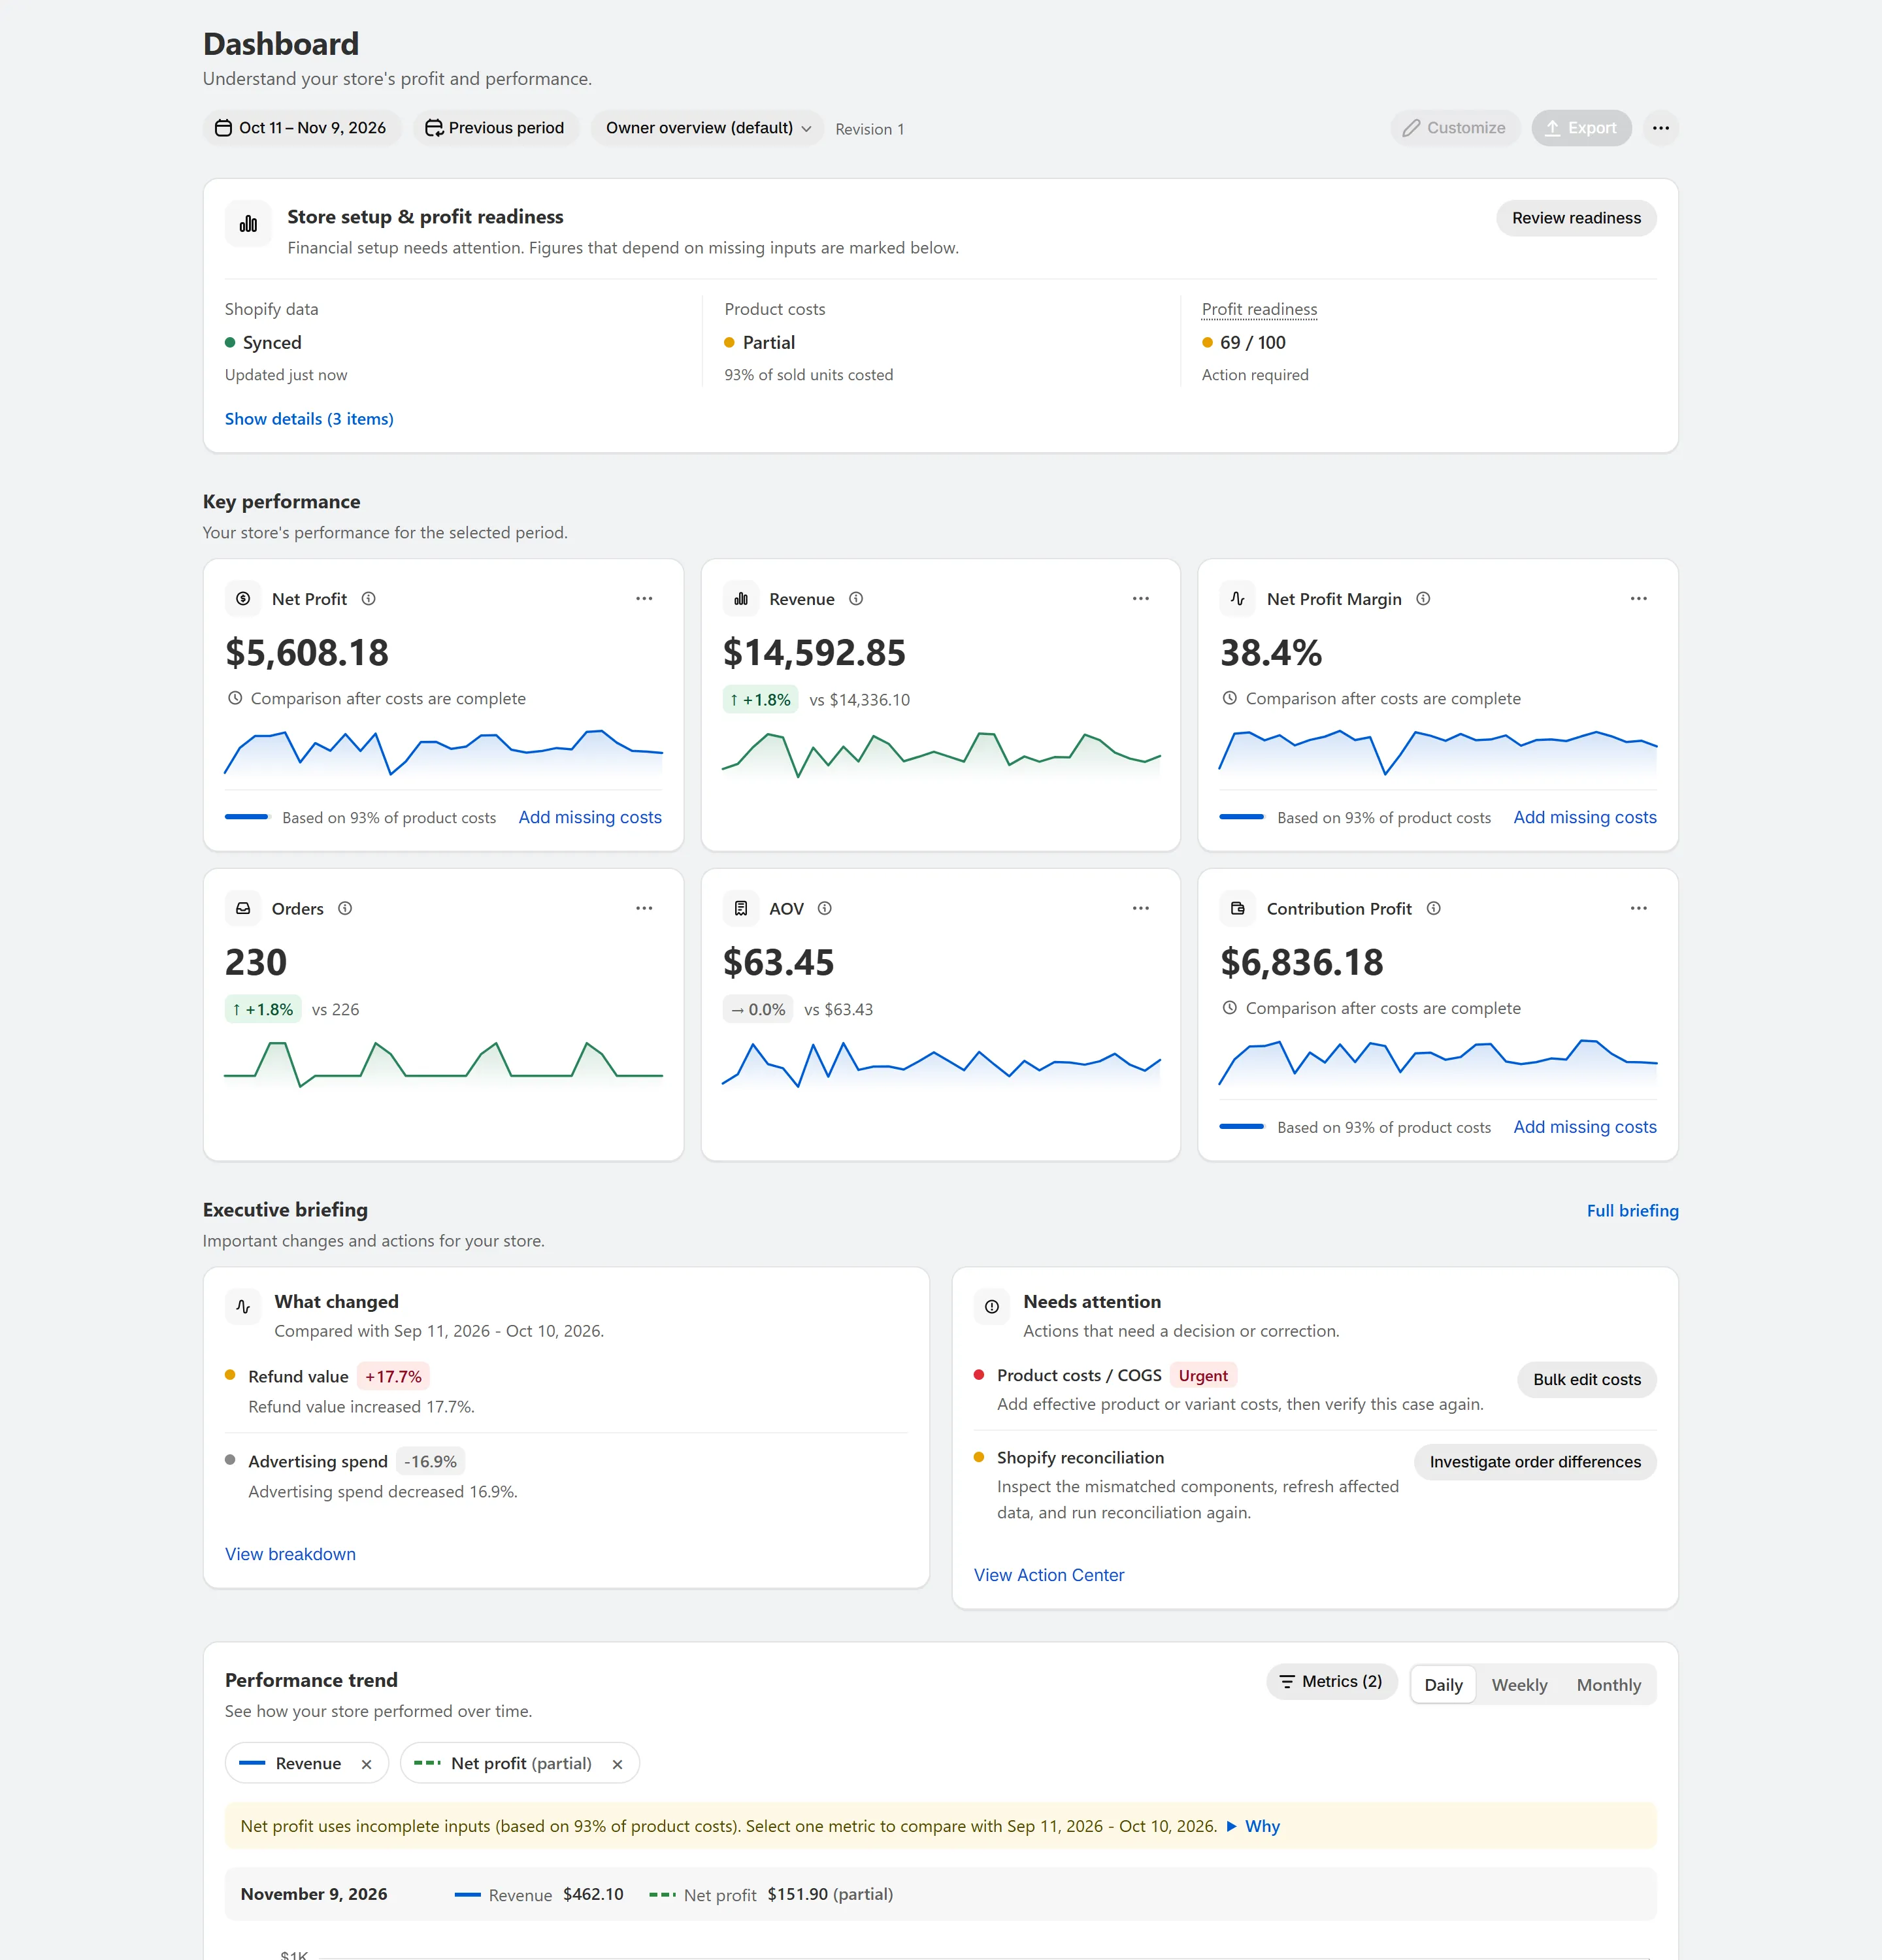
Shown with sample data.
- Period and view. Choose the date range, the comparison (previous period, previous month, previous year or custom) and which saved view to show.
- Store setup & profit readiness. Appears while inputs are missing and links to the fix.
- Key performance. The first six metrics of your view: by default net profit, revenue, net margin, orders, average order value and contribution profit.
- Your metrics. Every other metric in your view, in the same card style.
- Executive briefing. What changed and what needs attention.
- Performance trend. Up to four metrics over time.
- Costs and store activity. Where the money went, plus order and customer summaries.
Each card shows the value, the change against the comparison period (or a short note when it is paused), a sparkline, and a coverage note at the bottom when an input is incomplete.
Related
Section titled “Related”Still stuck? Email [email protected].