
Performance trend
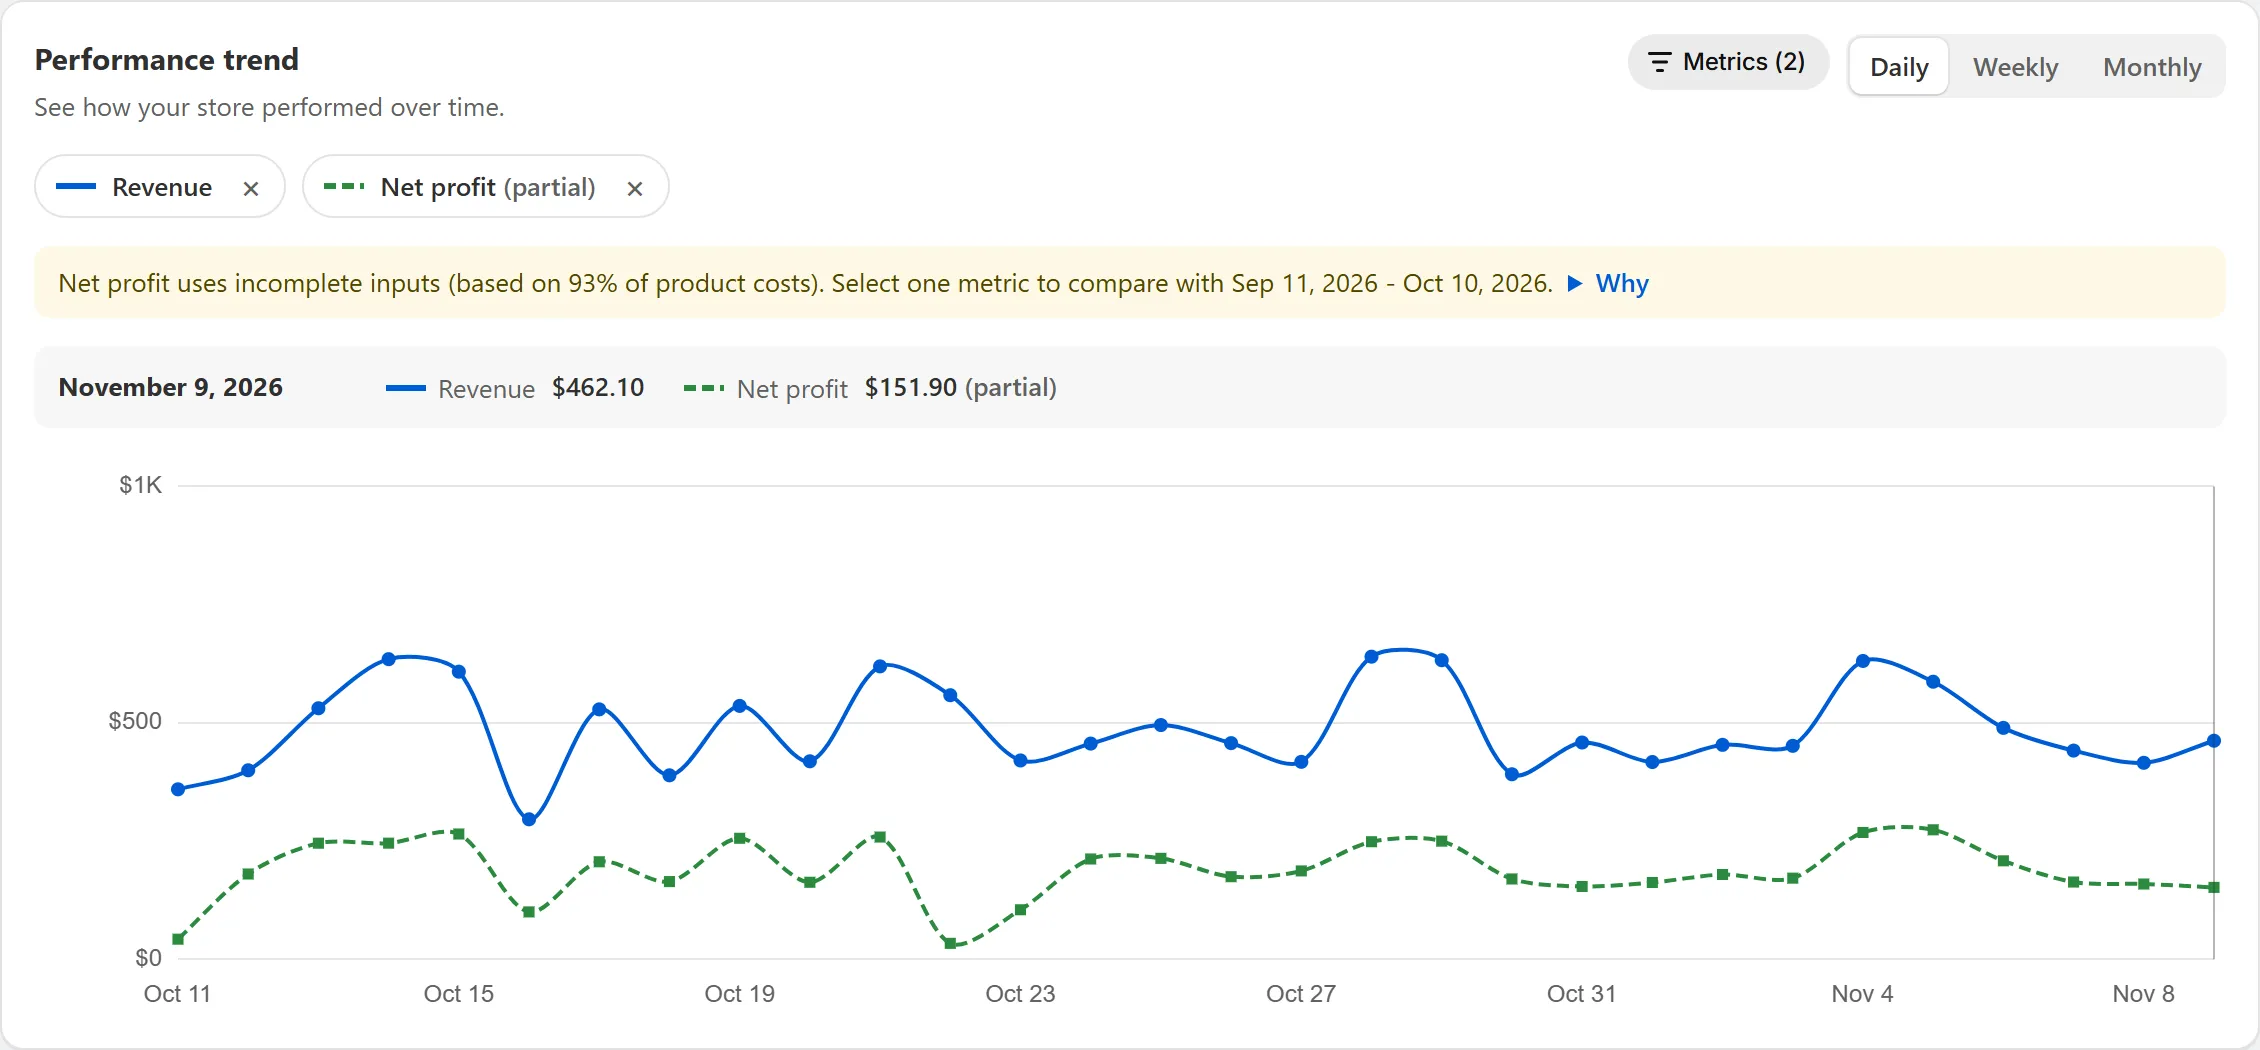
Shown with sample data.
- Select Metrics to choose up to four metrics, or use Add to trend from a card’s menu.
- Switch between Daily, Weekly and Monthly.
- Hover or tap the chart to see exact values for a date.
- Metrics in different units (money, percentages, counts) are drawn in their own bands so they are never visually compared on one scale.
- Partial or estimated values are labelled, and comparison lines are only drawn when the comparison period is complete.
Related
Section titled “Related”Still stuck? Email [email protected].