Dashboard
Net profit first. Every number shows how complete it is.
See net profit, revenue, margin, orders and contribution profit for any period, with coverage on every card and comparisons that pause when they would mislead.
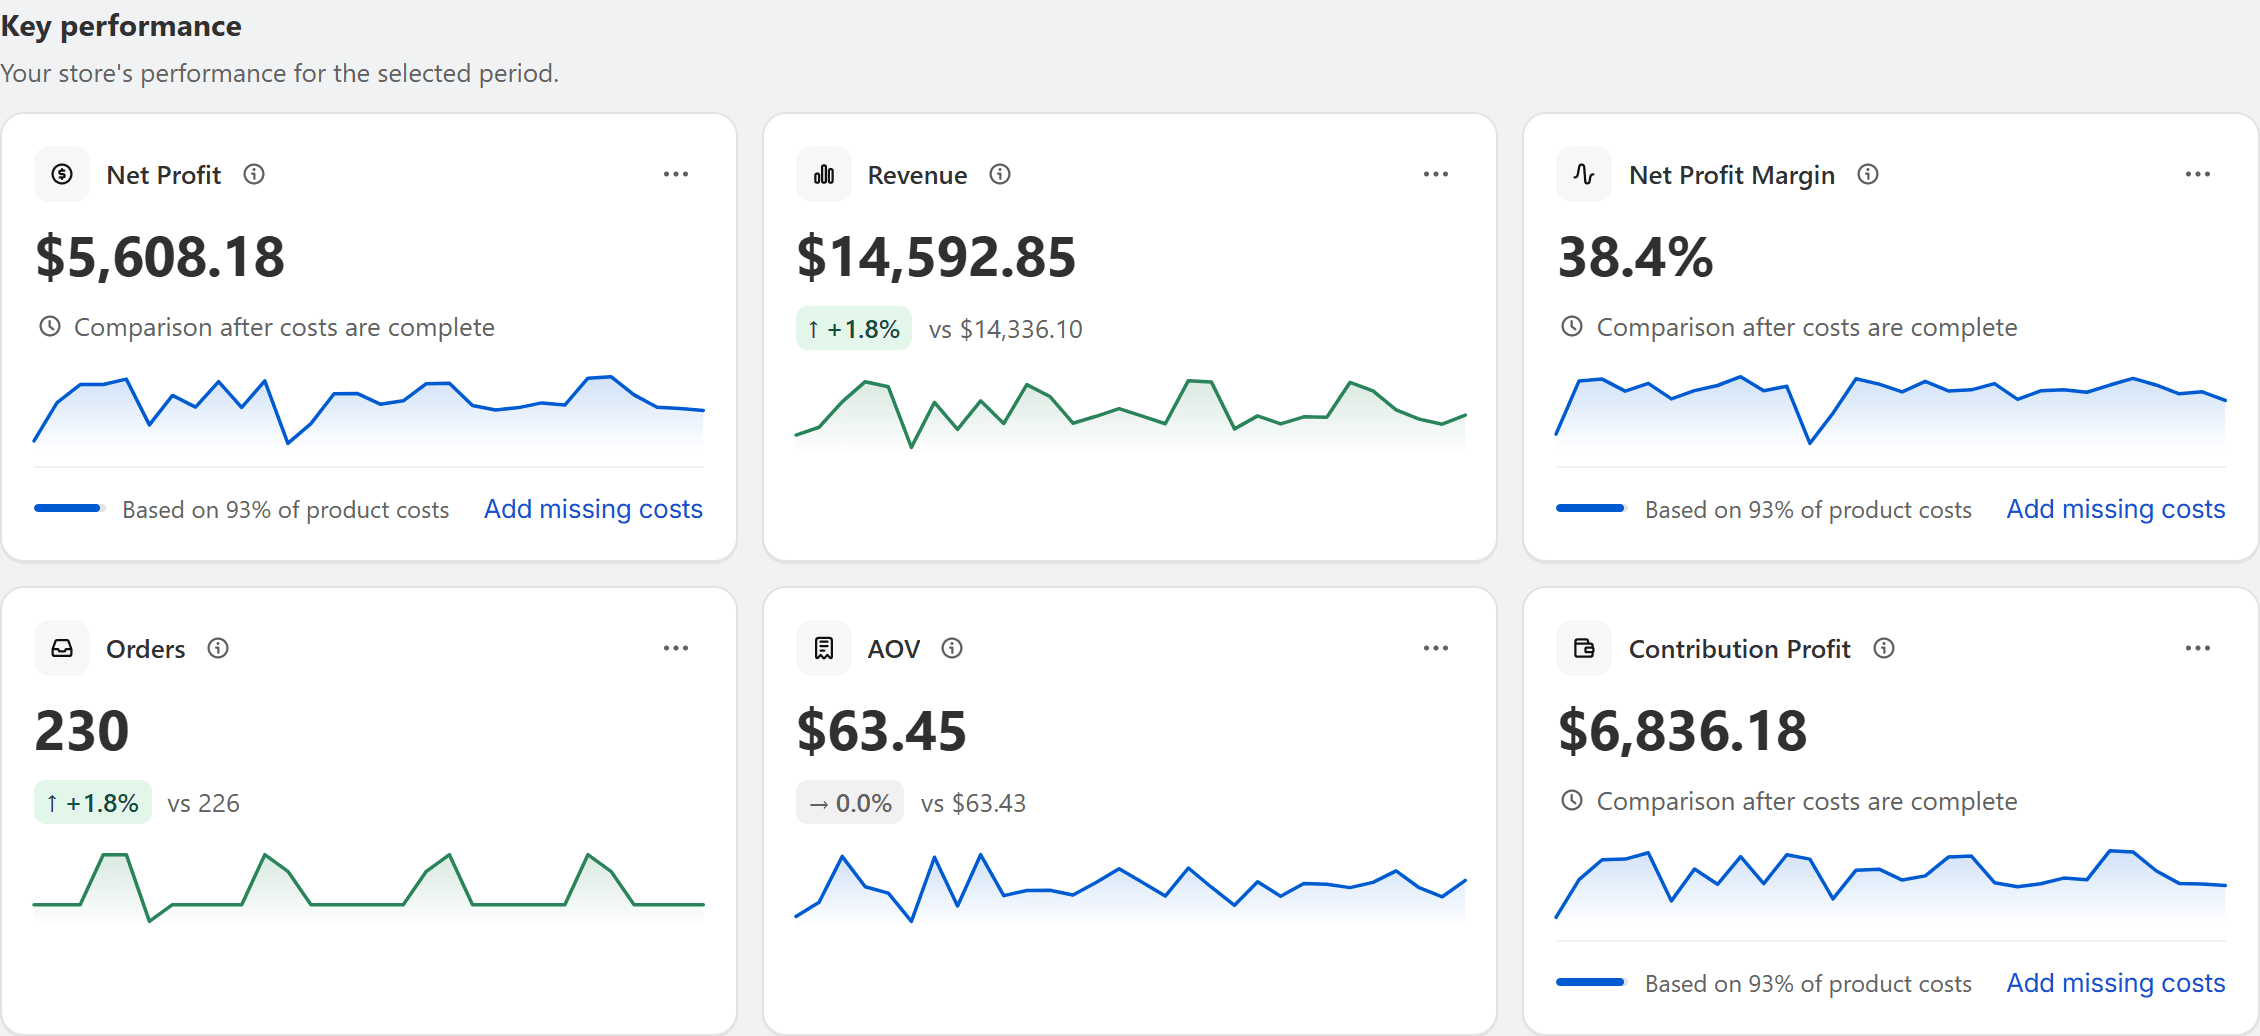
Coverage on every card
Notes such as “Based on 93% of product costs” show when a number rests on incomplete inputs. Missing costs are never shown as $0.
Honest comparisons
Compare with the previous period, month or year. When the data would mislead, the change pauses and the card says why.
Today so far
Revenue, orders, AOV and gross profit for today, compared with yesterday up to the same time, so half a day is never set against a whole one.
Click any number
Open the orders or products behind any card, on the same dates, sorted by what drives the figure.
Executive briefing
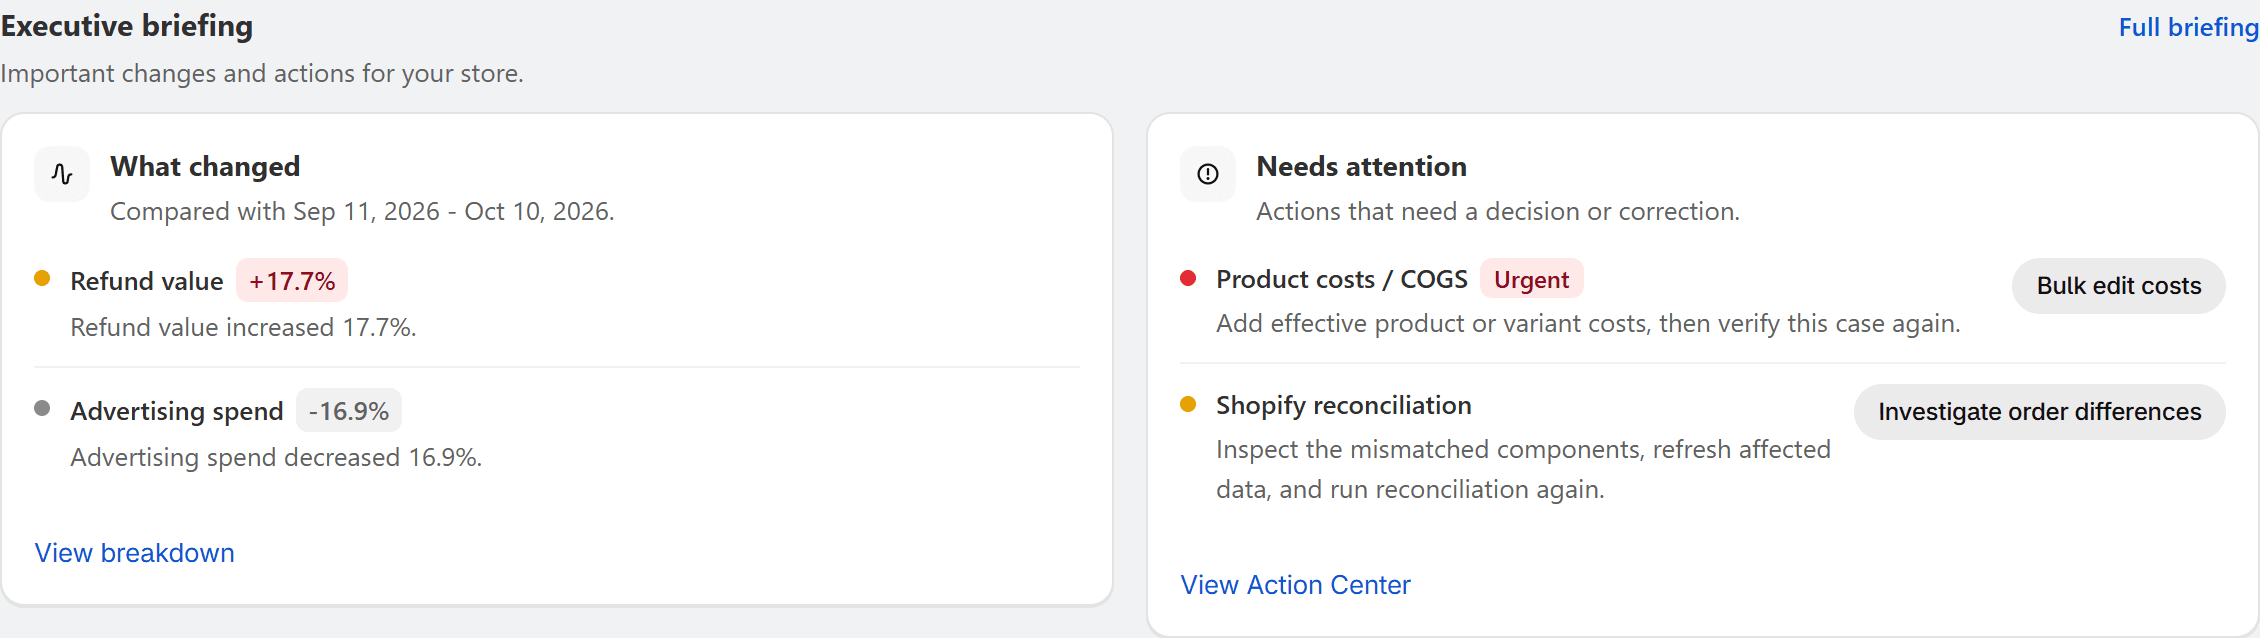
The biggest changes for the period in plain language, next to the actions that need a decision.
Performance trend
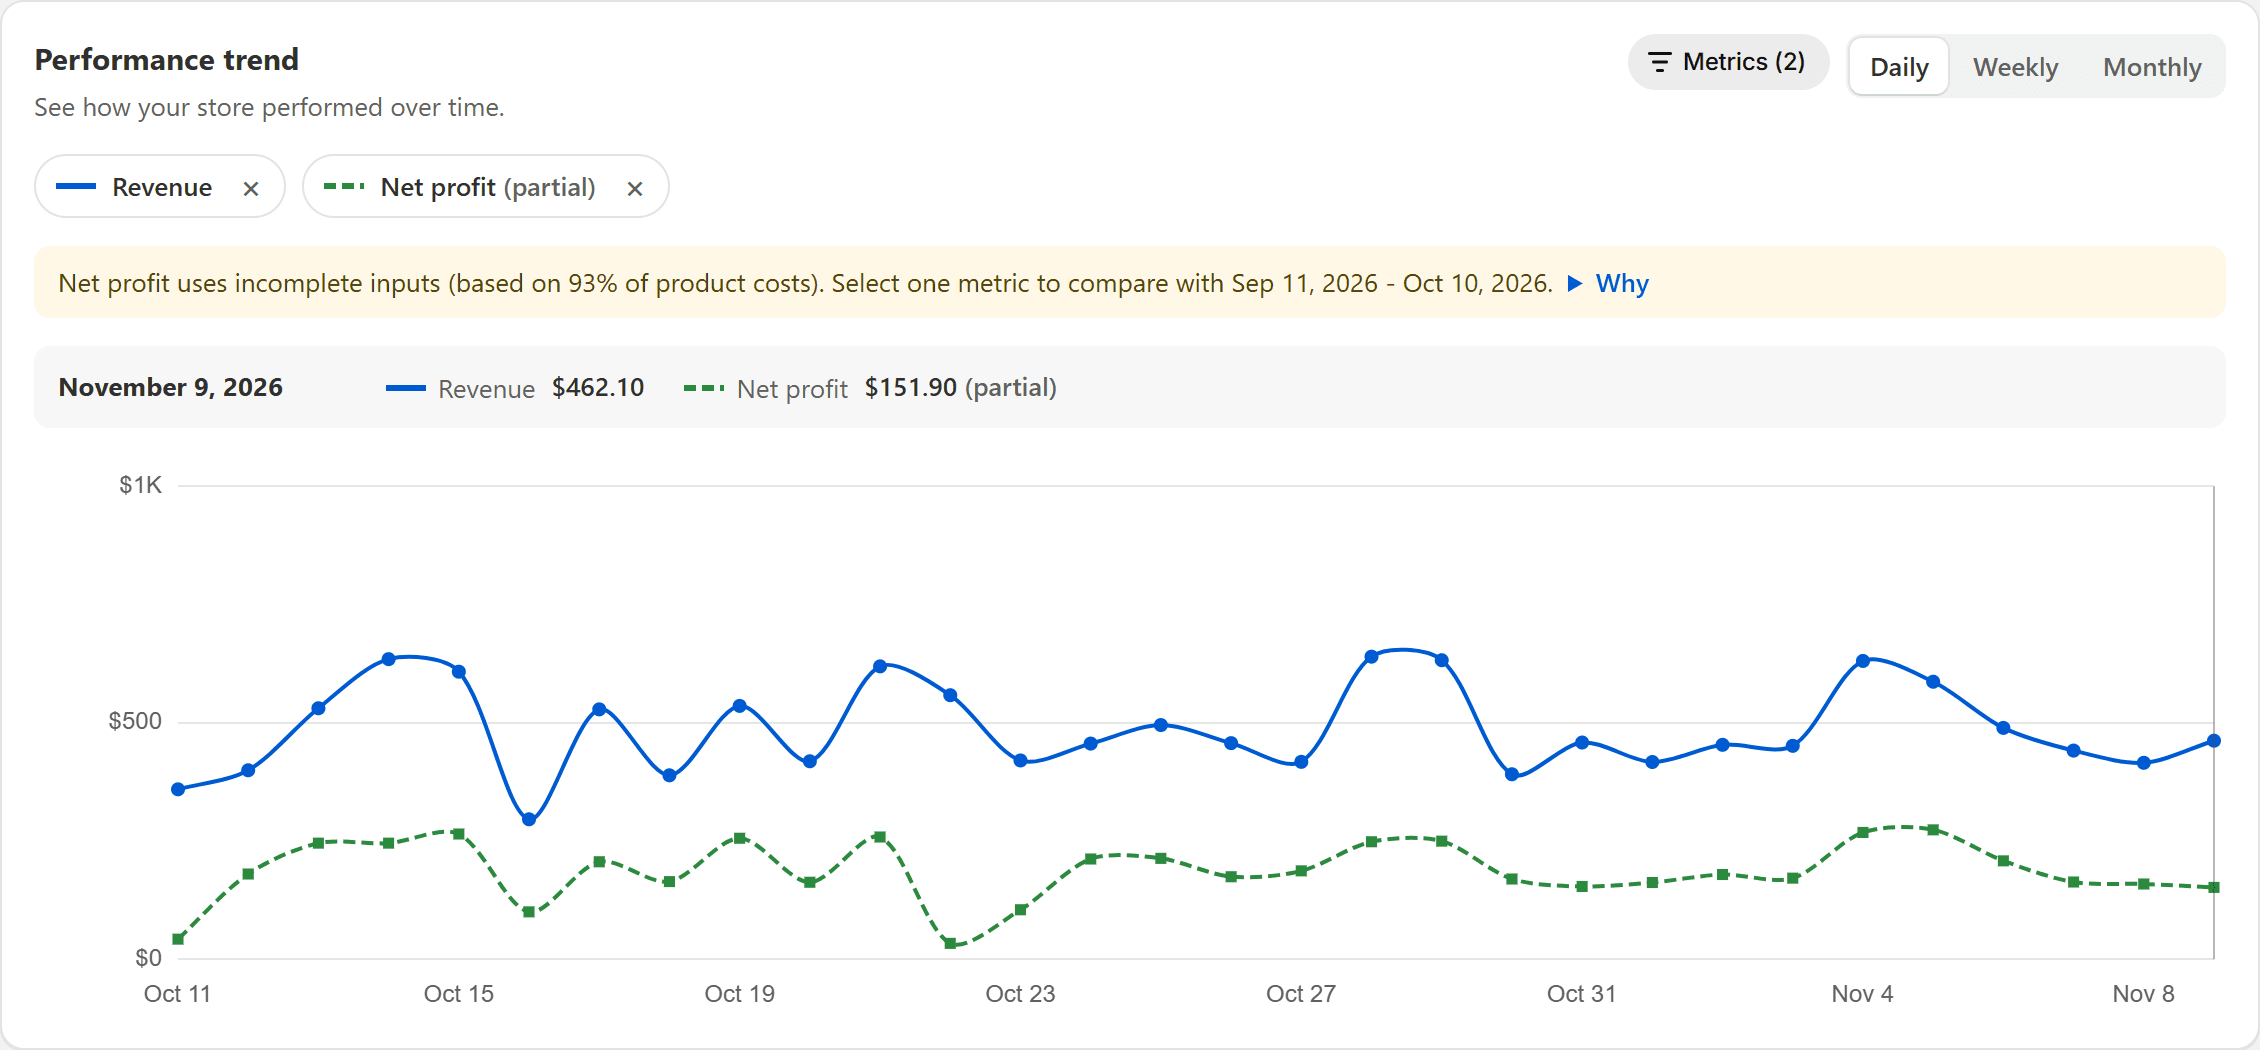
Chart up to four metrics together, daily, weekly or monthly, with partial data clearly marked.
Make it yours
Saved views with revision history, templates, custom formula metrics and targets with pacing.
Export
Download the dashboard as CSV, Excel or PDF, depending on your plan.
Explore more
Costs
Product costs with effective dates, shipping, payment fees and your own operating costs. Optifin shows how much of each is covered and what changes when you edit a cost.
Orders & productsOrders and products
Open any order to see exactly how its profit was calculated, and rank products by real profit, not just sales.
CustomersCustomers
Customer lifetime value on revenue and on profit, retention curves, cohorts and segments built on contribution, not just order counts.