Dashboard
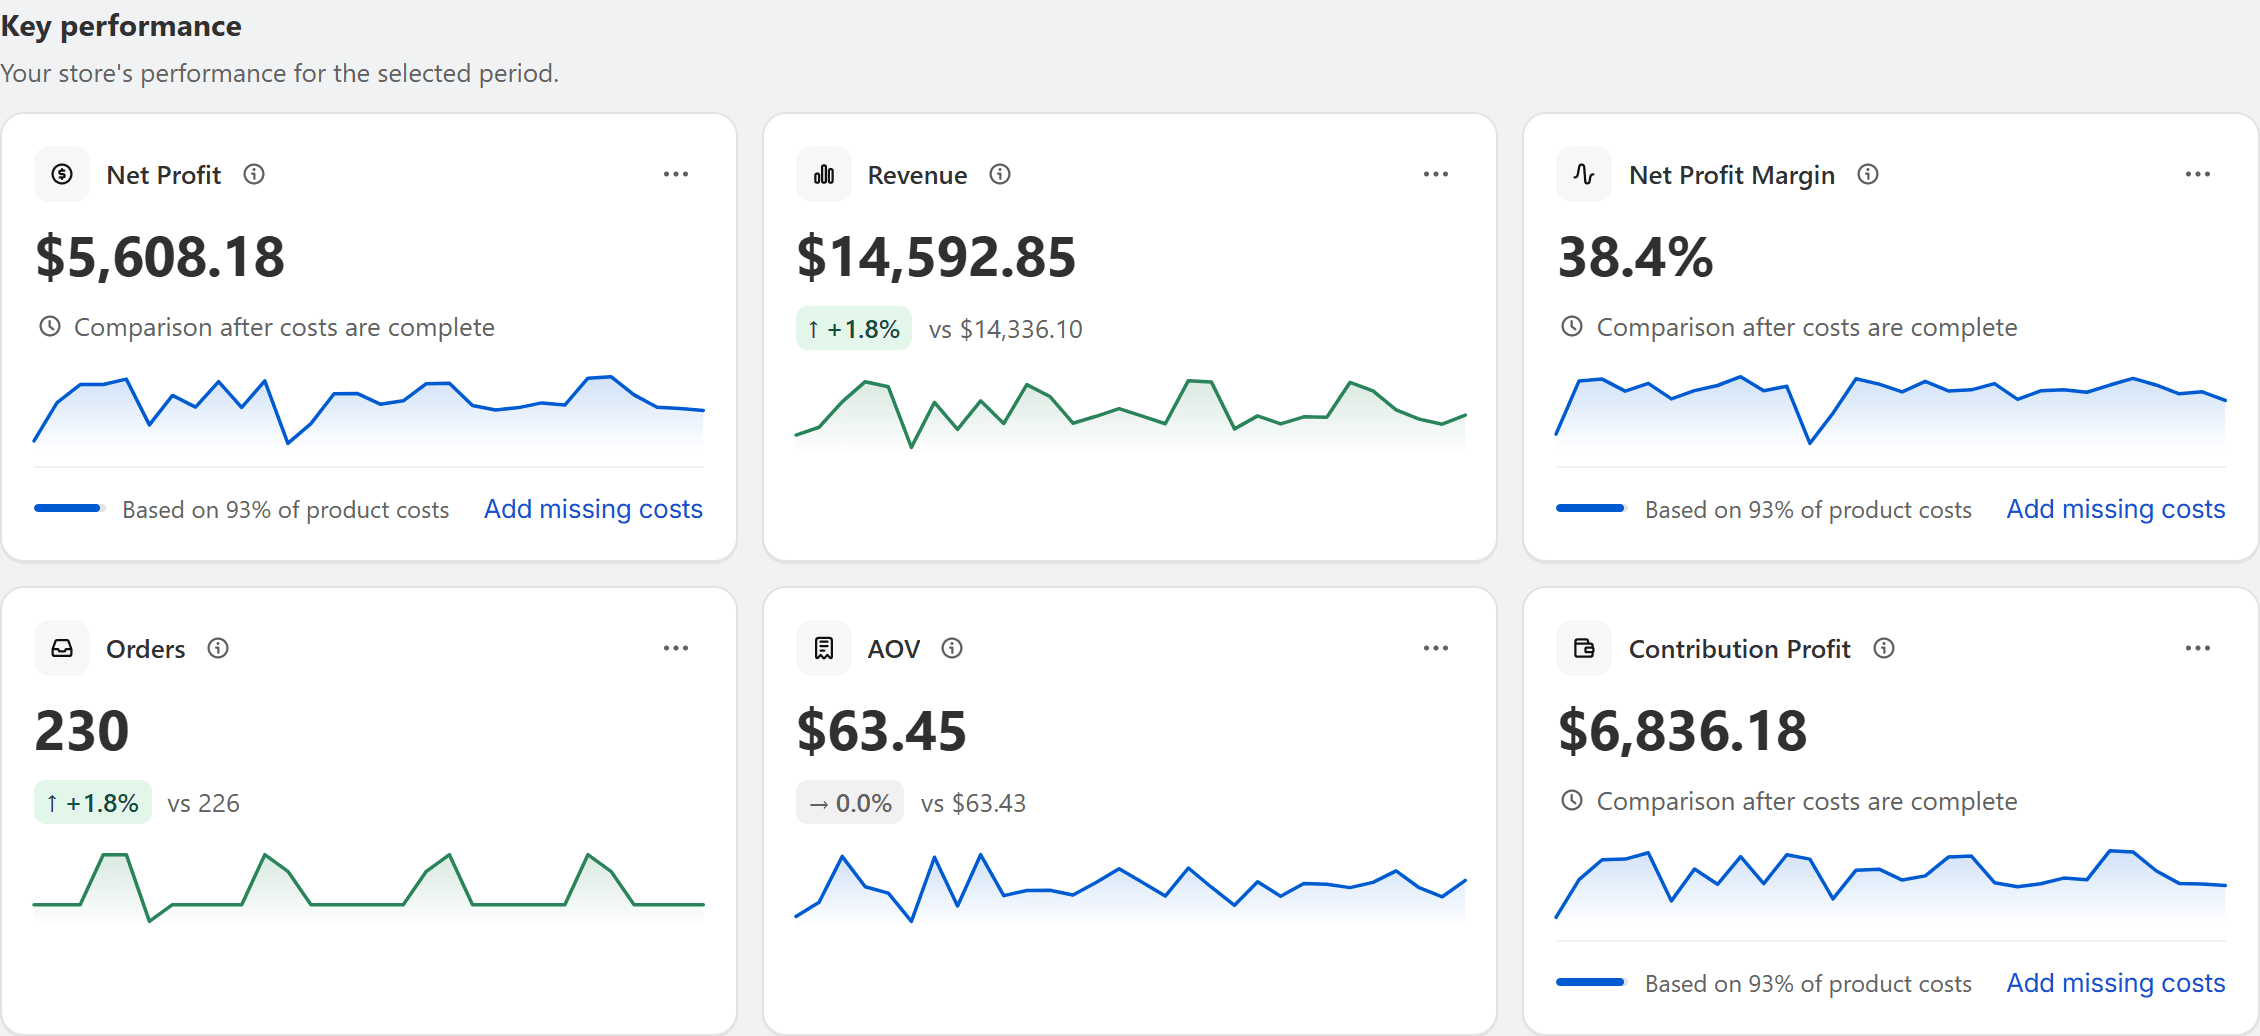
Net profit first. Every number shows how complete it is.
See net profit, revenue, margin, orders and contribution profit for any period, with coverage on every card and comparisons that pause when they would mislead.
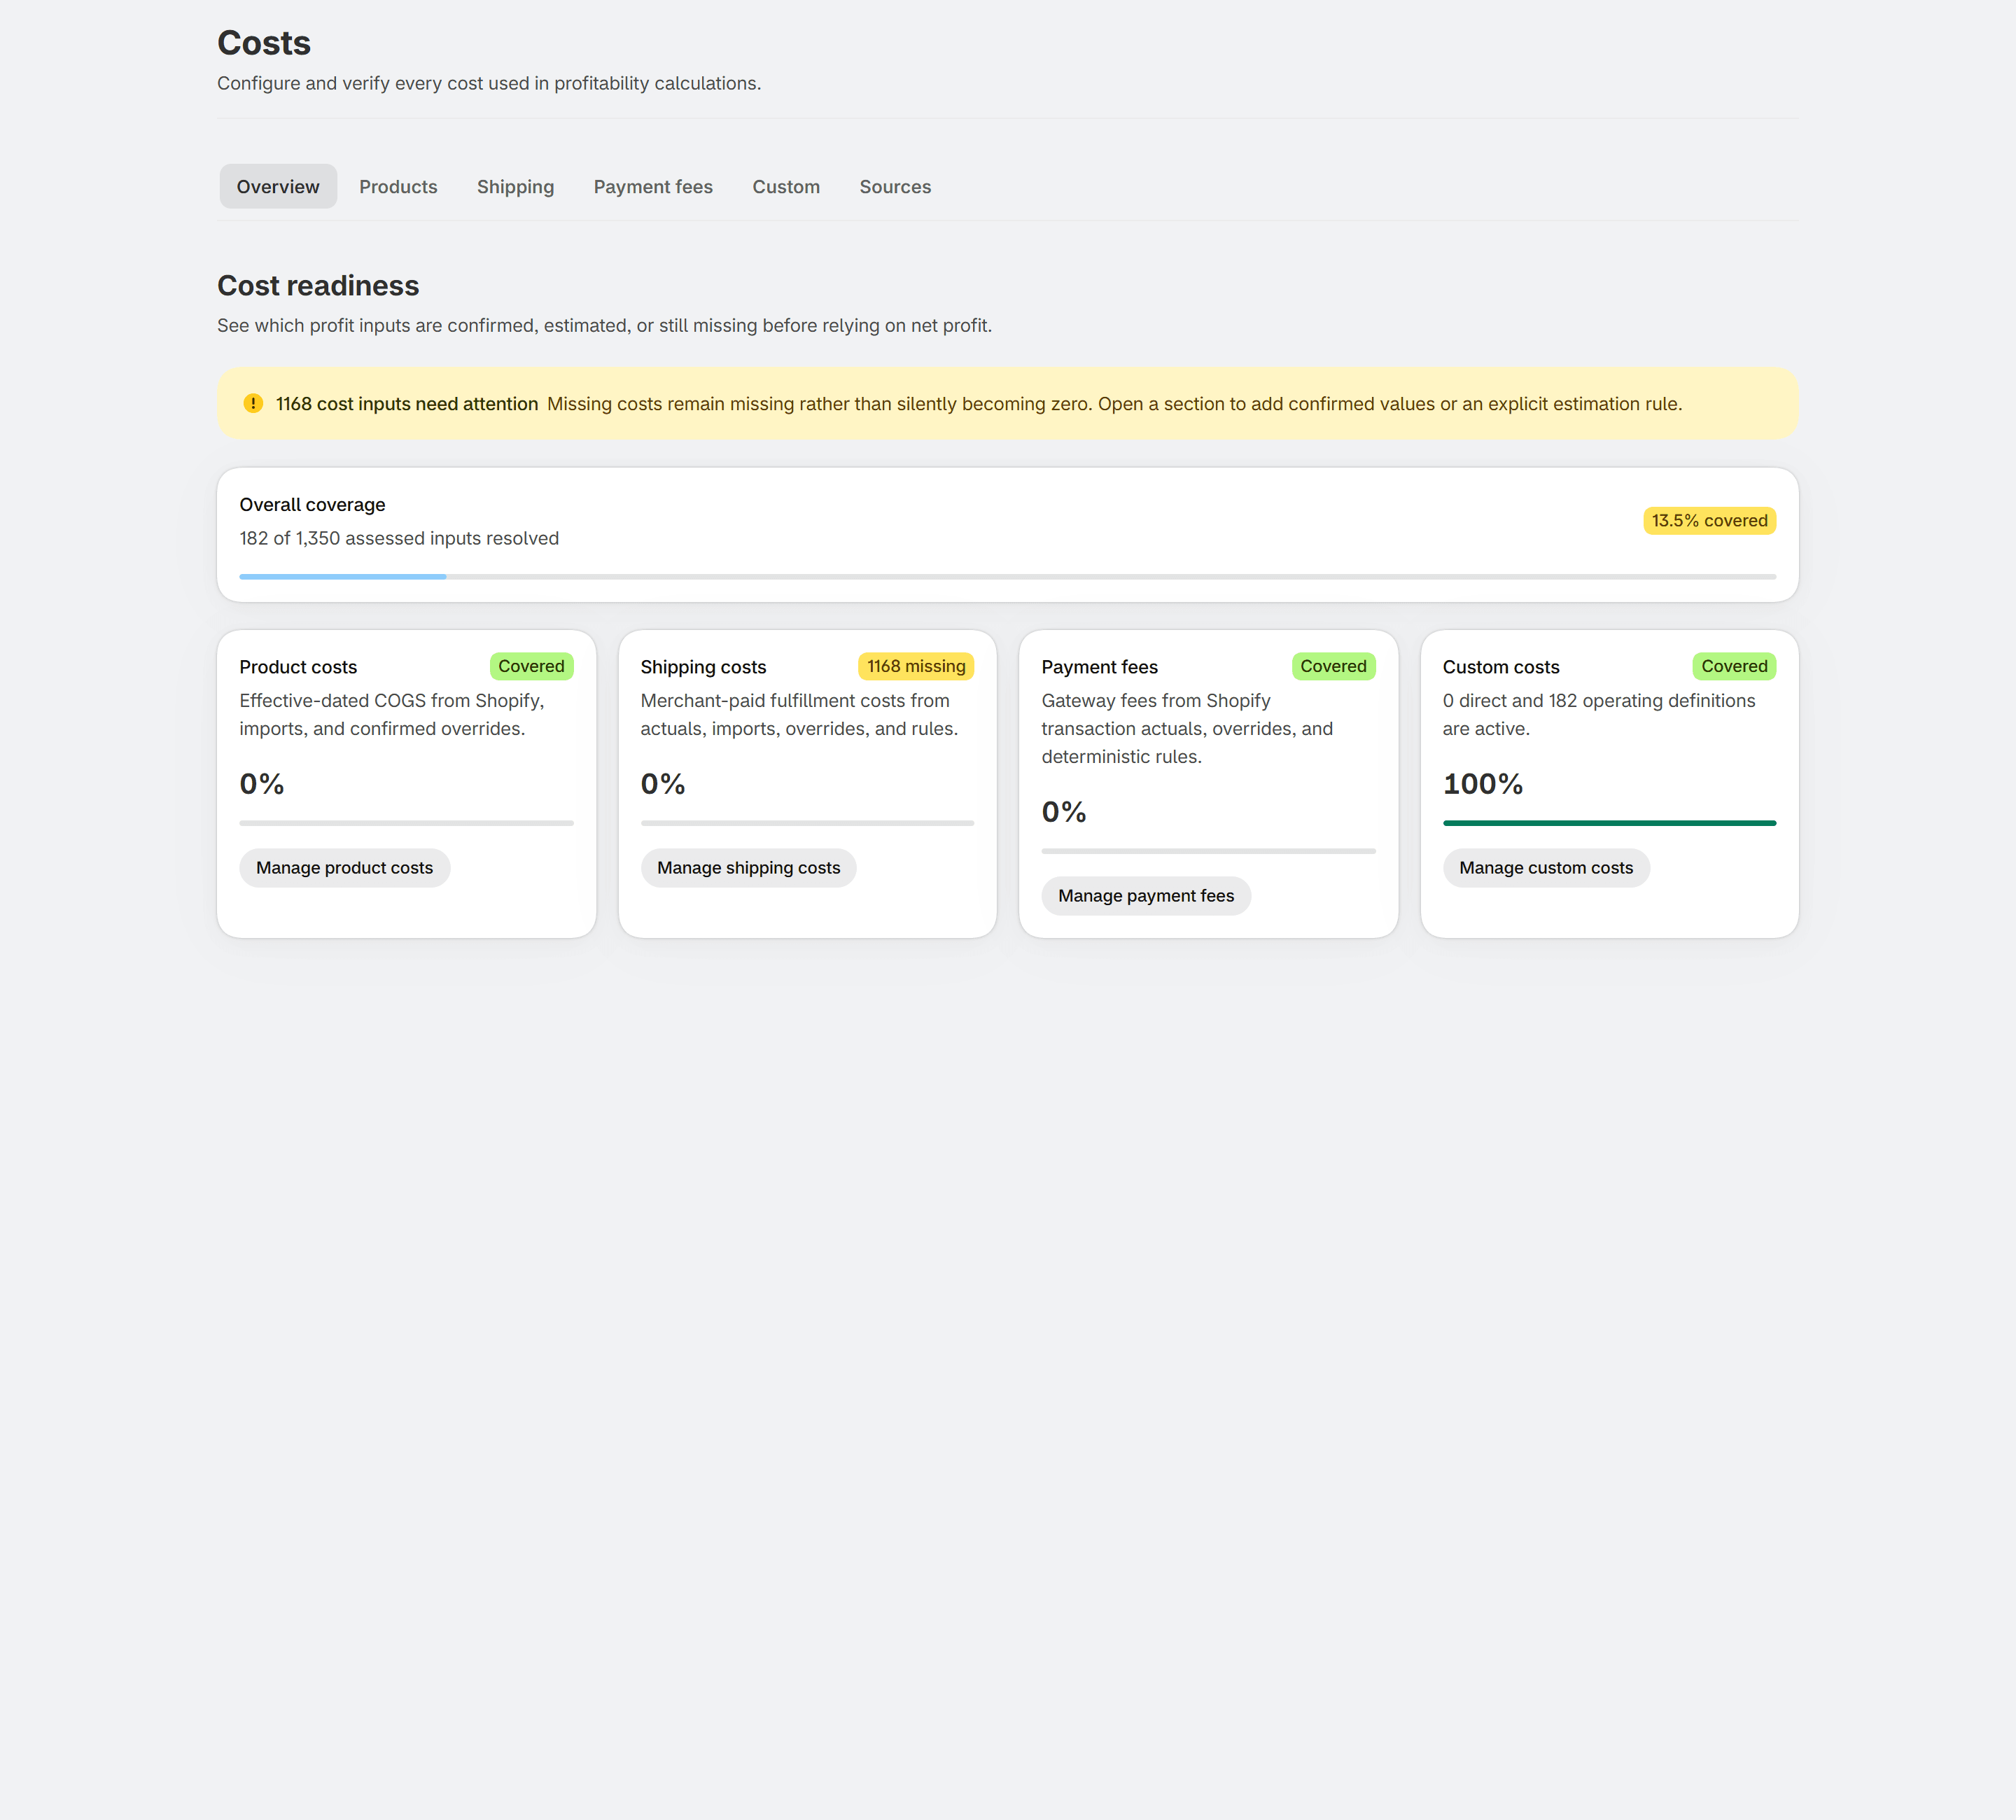
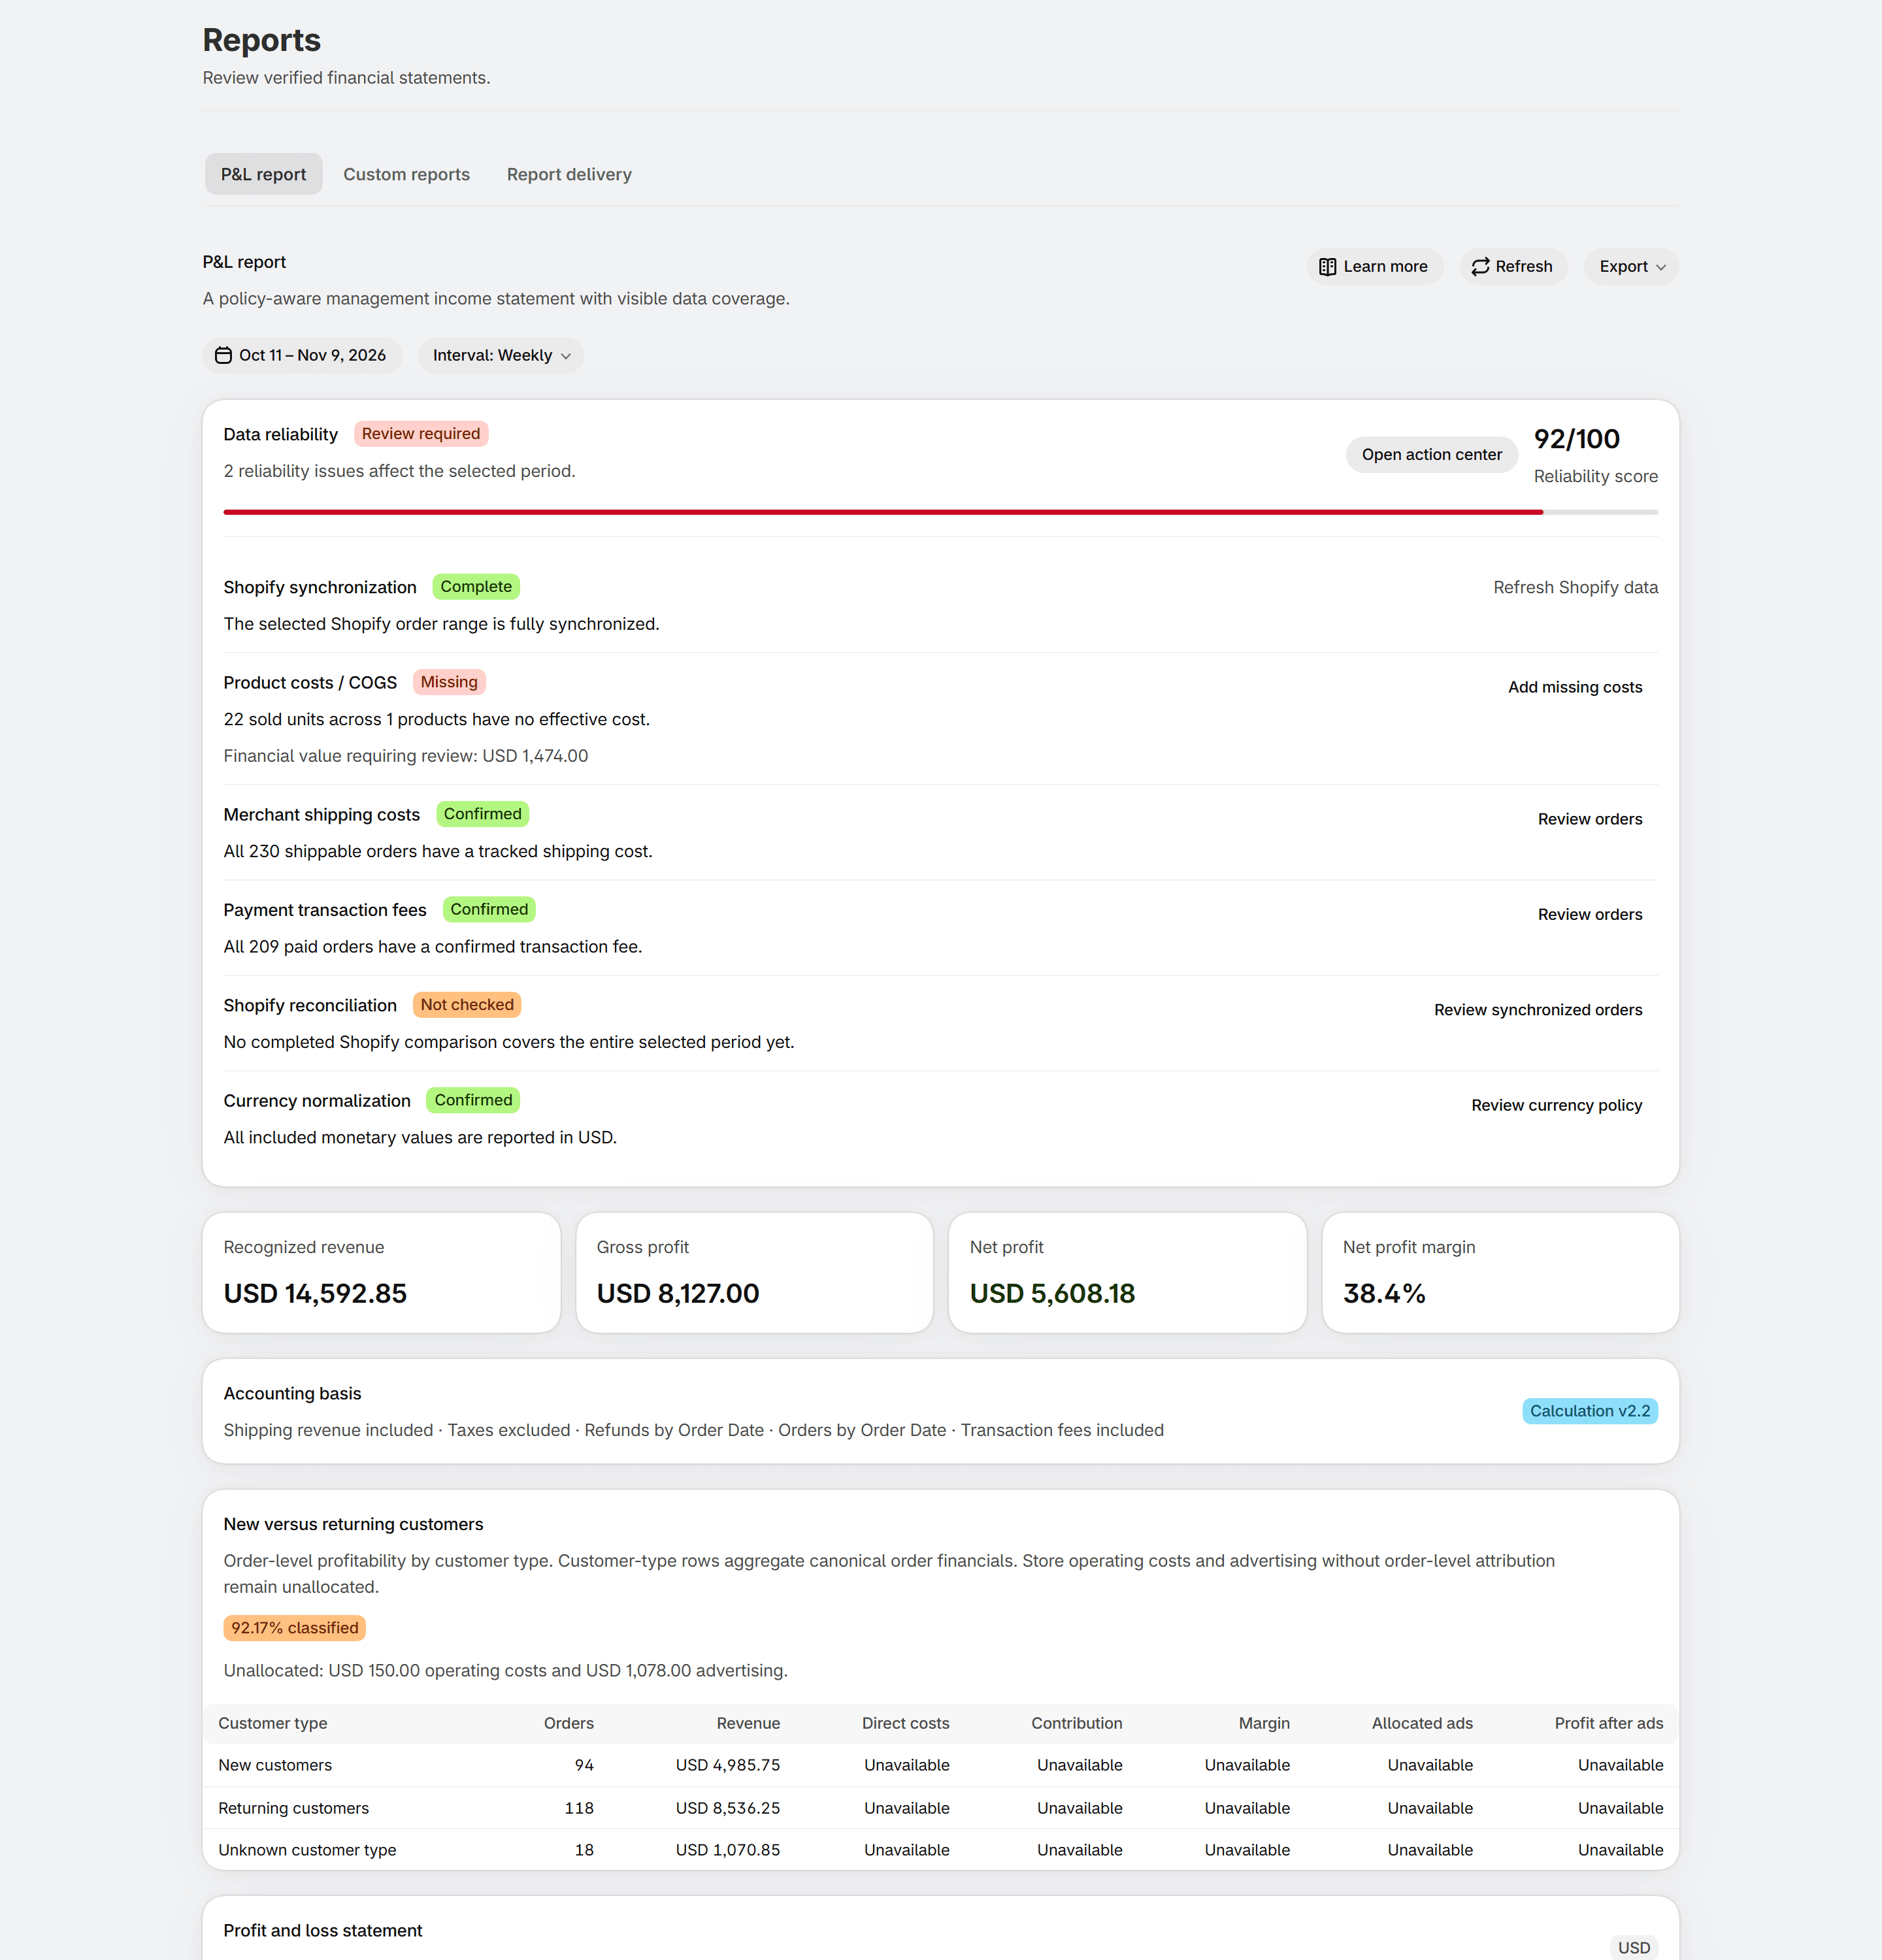
- Coverage on every card. Notes such as “Based on 93% of product costs” show when a number rests on incomplete inputs. Missing costs are never shown as $0.
- Honest comparisons. Compare with the previous period, month or year. When the data would mislead, the change pauses and the card says why.
- Today so far. Revenue, orders, AOV and gross profit for today, compared with yesterday up to the same time, so half a day is never set against a whole one.